23389 stories
·
1 follower

Who the safety net leaves behind

1 Share

The U.S. made remarkable strides in reducing poverty in recent decades, but one group was left behind — working-age adults who aren't raising children.

Why it matters: While key tax breaks and support programs lift a significant percentage of children, parents and older Americans out of poverty, they barely move the needle on this group, finds a striking series of papers from the Hamilton Project at Brookings released Wednesday.


State of play: One out of every two people in the U.S. who live in deep poverty — 50% below the poverty line — is a member of this population.

  • More than 70% of the homeless population falls into this group, which totals about 14 million adults aged 18-64, says Robert Greenstein, the founder of the Center on Budget and Policy Priorities and author of one of the papers.

How it works: In his research, Greenstein compares poor working-age adults who aren't raising kids or collecting disability benefits to other groups of poor people, looking at how government programs — and federal taxes — either pulled people out of, or pushed them into, poverty.

  • He compared data from the Census and the Department of Health and Human Services from 1970 to 2017, the most recent year with complete data not affected by pandemic-era irregularities.

By the numbers: Back in 1970, federal income tax and payroll taxes pushed more children and working parents below the poverty line than government social programs lifted out — producing a 4% net increase in the poverty rate among children, and an 11% increase among working parents.

  • By 2017, that had radically changed: 38% of otherwise poor parents and 44% of children were pulled out of poverty by tax policies and benefits.
  • Meanwhile: Only 8% of otherwise poor working-age adults without children were pulled out of poverty by government programs in 2017 — an increase of just 1 percentage point compared with 1970.

The difference makers were new things like the child tax credit, lower income taxes, and, especially, the earned income tax credit, a benefit for lower-income workers meant to stop taxing people into poverty and encourage them to work.

  • Single folks, without dependents, obviously don't get a child tax credit —and they also don't see much benefit from the EITC.
  • In 2020, the average annual EITC benefit for this group was $295, compared to $3,099 for families, according to CBPP data.
  • Stunning stat: About 5 million adults, who aren't raising kids at home, are taxed into poverty or pushed deeper into it, the paper finds

Zoom out: The U.S. appears to be the exception here. Other developed countries do more, per a different paper out Wednesday.

  • For starters, these countries have a higher minimum wage. The paper compared poverty reduction efforts in the U.S. to other countries including Canada, the U.K., and the Netherlands, and found that the U.S. is the only one where working full-time at minimum wage doesn't lift you above the poverty line.

Between the lines: There's a strong notion of self-reliance and "bootstrapping" in the U.S. — a tendency to blame poverty on individuals instead of structural circumstances.

  • Plenty of policymakers believe that if you're able-bodied and theoretically can get a job, you don't need help and should fend for yourself.

The big picture: About half of this population — poor adults without disabilities or kids — is in the labor force, according to research in a third paper co-authored by Lauren Bauer, a fellow at Brookings.

  • Many are dealing with the inconsistent scheduling that's typical in low-wage jobs, possibly not getting enough hours from their employer to get by.
  • Those who aren't working may not be "able-bodied," but instead dealing with health issues that fall out of the purview of government-determined disability insurance.
  • They may be adults just out of the foster care system who've had little help getting on their feet, or adults caring for the elderly or those with disabilities. And though none are "custodial" parents, this is a population that does include fathers and mothers of young children.

The bottom line: The U.S. safety net leaves out a lot of people who need help.


Read the whole story
ARCEvolution
2 days ago
reply
Share this story
Delete

Working from Home: The Metro-Level Shifts

33n
1 Share

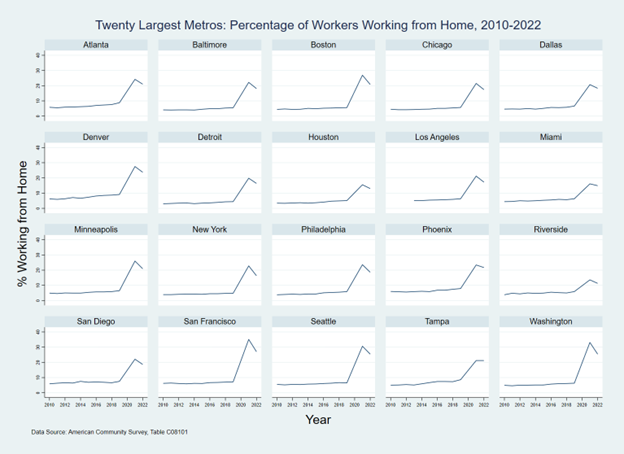
In previous blog posts, we have explored the growth of work from home (WFH) in the Atlanta region. [1] First, we saw a slow, steady rise over the 2010s. A large spike due to pandemic onset followed. Finally, there was a small decline in 2022 to what may well be the “new normal” for WFH.

How does Atlanta compare to other metros? To address this question, we return to data from the American Community Survey (ACS), specifically the 1-year estimates for metropolitan core-based statistical areas.[2]

Figure 1 shows the change over time (2010-22) in the percent working from home for the twenty most populous CBSAs.[3] It shows that the general pattern observed for Atlanta is almost universal. The lone exception is found in Tampa, where WFH share held steady between 2021 and 2022 rather than declining.

Figure 1: Trends in Shares Working From Home, Twenty Largest Metros, 2010-2022 (Source: ACS)

alt

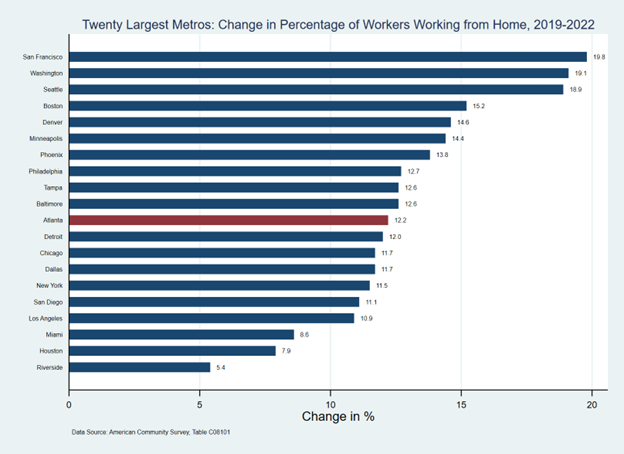
Figure 2 below focuses on the change in percent WFH between 2019 and 2022 for these same twenty metro areas. We see that Atlanta is in the middle of the pack, ranked #11 of 20, with an increase of 12.2 percentage points in WFH share from 2019 to 2022.

Figure 2: Percentage Point Change in Shares WFH, Twenty Largest Metros, 2019-2022 (Source: ACS)

alt

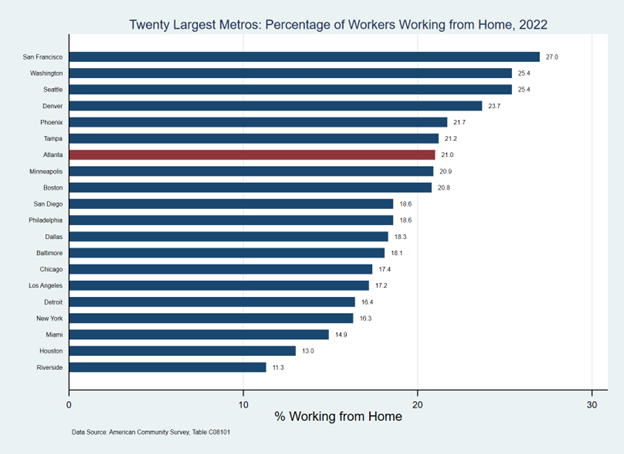
The limited “growth” in share for Atlanta is due in part to the fact that Atlanta started at a higher percentage of WFH than many of its peers. Figure 3 that follows shows that, at 21%, Atlanta is ranked #7 among the twenty largest metros, as of 2022, in terms of working from home…as opposed to 11th in change 2019 to 2022.

Figure 3: Shares Working from Home, Twenty Largest Metros, 2022 (Source: ACS)

alt

What accounts for the variation between metro areas in terms of WFH? Let’s consider two indicators: one that measures motive, and the other opportunity.

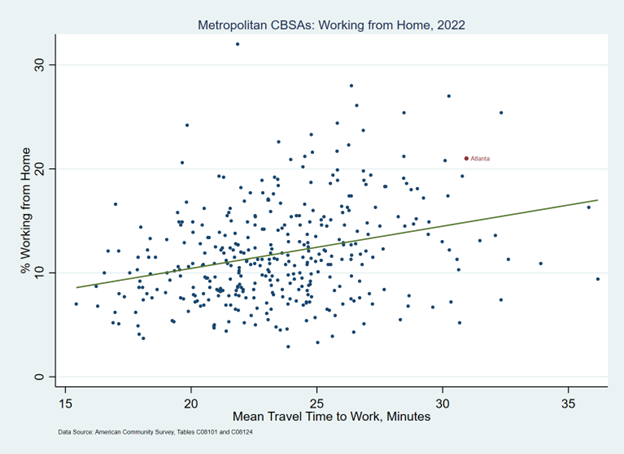
The pain of commuting can provide a powerful motive for working from home. Figure 4 below shows the relationship between the mean travel time for commuters and the percent working from home for all metropolitan CBSAs nationwide. The trend line has a slope of .41.[4] With a mean travel time to work of 30.9 minutes and 21% WFH rate, Atlanta falls somewhat above the trend line. However, this relationship is not particularly strong, in that the points in this scatterplot do not hew closely to that prediction line (r=.29).

Figure 4: Metro Shares Working from Home Compared to Mean Travel Time, 2022 (Source: ACS)

alt

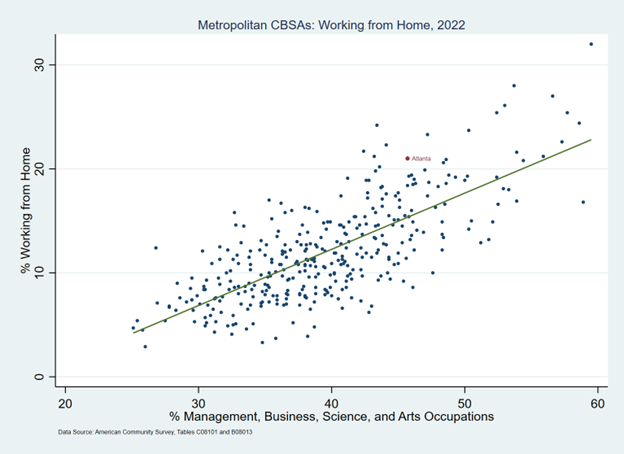
But we must recognize that not all jobs are equal in their opportunity for WFH, as some jobs must be performed in person. Figure 5 shows the relationship between the percent of workers in management, business, science, and arts occupations (arguably the most white-collar, or “office-using” among the occupation categories) and percent WFH.[6] The dots in this plot cluster tighter to the trend line than the previous graph, indicating a much stronger relationship (r=.74) Again, the trend line is positive, with a slope of .54.[5] The Atlanta CBSA again lies a bit above the prediction line, with 45.7% of its workers in these white-collar occupations, and 21% WFH.

Figure 5: Metro Shares Working from Home Compared to Shares of “Office-Using” Occupations, 2022 (Source: ACS)

alt

So, while Atlanta exhibits a WFH rate a bit higher than we might expect based on these two criteria, it is not a crazy outlier either.[7]

Footnotes:

[1]https://33n.atlantaregional.com/data-diversions/did-we-return-to-the-office-in-2022 and https://33n.atlantaregional.com/data-diversions/whos-working-from-home

[2] Core-based statistical areas (CBSAs) are delineated by the Office of Management and Budget. They consist of groups of counties with a “high degree of economic and social integration” (think commuting patterns) with one or more core urban areas. The most recent iteration of Atlanta’s CBSA, as of July 2023, is officially called the “Atlanta-Sandy Springs-Roswell, GA” Metropolitan Statistical Area and recognizes six principal core cities: Alpharetta, Atlanta, Dunwoody, Marietta, Roswell, and Sandy Springs. CBSAs come in two flavors: metropolitan CBSAs have at least one core city with population over 50,000, while micropolitan CBSAs have at least one core city of population at least 10,000, but none reaching 50,000 population. There are currently 393 metropolitan CBSAs and 542 micropolitan CBSAs in the United States. For more information about CBSAs, see https://www.census.gov/programs-surveys/metro-micro/about.html.

[3] We’re #6! In terms of population, per the Census Bureau’s most recent (2023 Vintage) estimates, that is.

[4] This means that that for each extra minute of travel time that commuters face, we can expect to see on average an additional 0.41 percentage point of work from home (WFH) share.

[5] Thus, for each additional percent of workers in these white-collar occupations, we would expect to see 0.54 percent additional WFH overall.

[6] ACS table C08124 reports means of transportation to work for six occupation categories: management, business, science, and arts occupations; service occupations; sales and office occupations; natural resources, construction, and maintenance occupations; production, transportation, and material moving occupations; and military specific occupations.

[7] That outlier in the far northeast corner of Figure 5? Boulder, Colorado.

The post Working from Home: The Metro-Level Shifts appeared first on 33n.

Read the whole story
ARCEvolution
2 days ago
reply
Share this story
Delete

Most Middle-Income Americans Say They Didn’t Get a Good Financial Education in School

1 Share

One of the most important skills needed to achieve financial security is understanding the fundamentals of following a budget, reducing debt and saving for retirement. Yet, despite being the world’s largest economy, the U.S. doesn’t even crack the top 10 list for financial literacy worldwide.

That lack of education can be particularly harmful for middle-income Americans, who are disproportionately impacted by factors such as high inflation and may find it more difficult to recover from down periods in the economy.  

That’s why it’s particularly noteworthy that Primerica’s Q1 2024 Financial Security Monitor™ (FSM™) survey found that 66% of middle-income Americans believe the financial education they received in school failed to adequately prepare them to manage their personal finances as adults. Specifically, respondents said they did not learn the necessary skills for a number of tasks, including doing taxes (71%), paying back student loans (67%), taking out and paying back loans (64%) or setting a household budget (59%).

The survey found a notable discrepancy among age groups as the youngest age brackets expressed the highest level of dissatisfaction with their financial education, with 73% of those ages 18-34, 69% of those ages 35-49 and 65% of those ages 50-64 saying they weren’t taught proper financial skills. In addition, 57% of women over the age of 65 felt the same way. Notably, 61% of men over the age of 65 said school did adequately prepare them, representing the only demographic where a majority felt positively about their financial education.

“We are seeing a clear lack of confidence among middle-income Americans who believe their education failed to prepare them to manage their personal finances, with an overwhelming majority of young people feeling left behind,” said Glenn J. Williams, CEO of Primerica. “These are gaps we have to recognize and address as people plan their financial futures and navigate a fluctuating economic environment that, in recent years, has left middle-income Americans feeling incredibly uncertain about their financial situations.”

Luckily, there are many steps middle-income families can take to shore up their financial future, such as educating themselves on key financial principles, practicing “loud budgeting” to prioritize healthy spending habits, cutting out frivolous spending and shopping splurges or simply starting a monthly budget.

No matter your income, age or current financial situation, taking such steps can help bolster your financial education and figure out the best route to financial success. And, as always, whether coming up with a financial game plan feels daunting or you just want to make sure you’re on the right track, reaching out to a financial professional may help ease your mind and give you the confidence you need to succeed.

This is sponsored content.

The post Most Middle-Income Americans Say They Didn’t Get a Good Financial Education in School appeared first on SaportaReport.

Read the whole story
ARCEvolution
2 days ago
reply
Share this story
Delete

Study: Mixed-use tower, bus hub viable near Stitch project, MARTA

1 Share
Study: Mixed-use tower, bus hub viable near Stitch project, MARTA Josh Green Tue, 04/16/2024 - 15:55

Downtown’s freeway-capping Stitch project might be two years away from breaking ground, give or take, but planning for large-scale development and transit improvements around it is well underway.

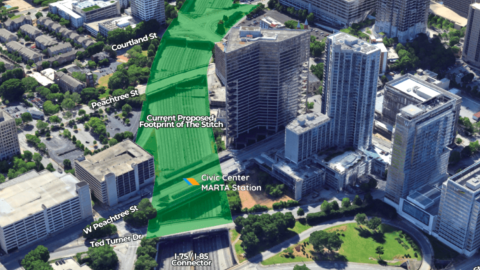
The Atlanta Downtown Improvement District has collaborated with MARTA to study the potential of transit-oriented development and a new, streamlined off-street bus transfer facility around the Civic Center station downtown.

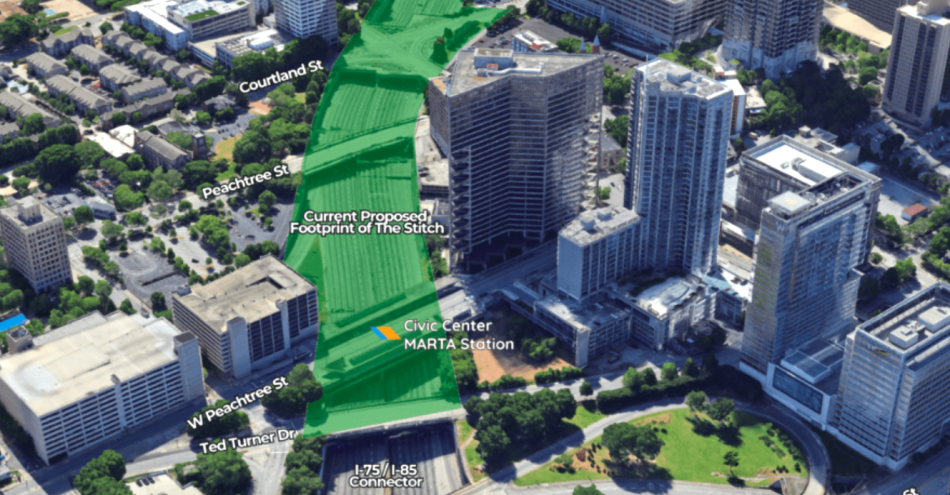
The MARTA station is located near the western boundary of the 14-acre Stitch concept, which secured a pivotal $157 million in federal funding last month to get its initial phase off the ground. At least one private development is already percolating in the immediate area.

What the study identified as Site A between the Connector, MARTA station, and Twelve Centennial Park tower. Atlanta Downtown Improvement District/MARTA

How the MARTA rail hub is expected to eventually mesh with the Connector-capping Stitch project. Atlanta Downtown Improvement District/MARTA

According to ADID, the project team finished an “exhaustive analysis” of possible sites to place the bus facility—each with ¼ mile of the transit hub—and to build another TOD adjacent to MARTA.

Collectively it’s called the Civic Center Station Transit Revitalization Study, and the final report was prepared last month. The goal is to “guide the future development of the Civic Center station area by promoting accessibility, multimodal connectivity, and vibrant urban growth,” per the analysis.

In addition to MARTA rail, the station serves a full network of regional bus operators, including Ride Gwinnett, Emory University’s system, Xpress, and CobbLinc.

The study looked at the potential for weaving a new bus-transfer facility into mixed-use development that would rise adjacent to the MARTA station, providing a more efficient end point for bus lines that terminate there. (Three potential scenarios are highlighted below.)

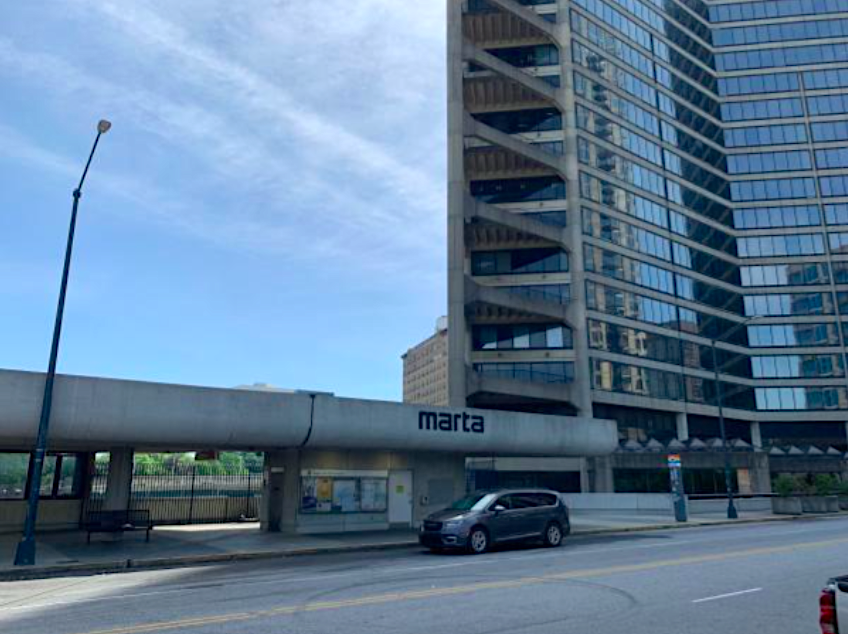
Where MARTA's Civic Center station meets West Peachtree Street today. Atlanta Downtown Improvement District/MARTA

Given its proximity to the Stitch and multiple transit options, the studied area “holds immense potential for growth and revitalization… [as a] unique opportunity to leverage transit infrastructure as a catalyst for economic development and community enhancement,” the analysis concludes.

The TOD component might already have a potential suitor on the line.  

It came to light last summer that early discussions were underway for building a 260-key, mixed-use Hilton hotel project at a vacant parcel (identified in the study as “Site A”) adjacent to the MARTA station in question, to include affordable housing units catered toward healthcare workers at nearby Emory facilities.

That roughly 1-acre site is located between Ted Turner Drive and West Peachtree Street, in the shadow of the 39-story Twelve Centennial Park hotel and condos. That building, completed in 2007, was intended to have a twin tower of equal height before the Great Recession squashed those plans.

Below is a quick summary of potential plans for a new off-site bus transfer facility at the doorstep of MARTA and the Stitch site:

The bus transfer facility's Horseshoe Alternative would be located within Site A. It would include a bus loop with space for roughly five bus bays.Atlanta Downtown Improvement District/MARTA

The larger Overbuild option would extend from Site A across the Connector, providing space for nine bus bays. Atlanta Downtown Improvement District/MARTA

This option would be designed for minimal impacts to Site A, with about four bus bays. The project team is also exploring a fourth alternative that would improve the existing bus transfer facility a block north of the station. Atlanta Downtown Improvement District/MARTA

...

Follow us on social media: 

Twitter / Facebook/and now: Instagram  

• Downtown news, discussion (Urbanize Atlanta)

Images

How the MARTA rail hub is expected to eventually mesh with the Connector-capping Stitch project. Atlanta Downtown Improvement District/MARTA

Where MARTA's Civic Center station meets West Peachtree Street today. Atlanta Downtown Improvement District/MARTA

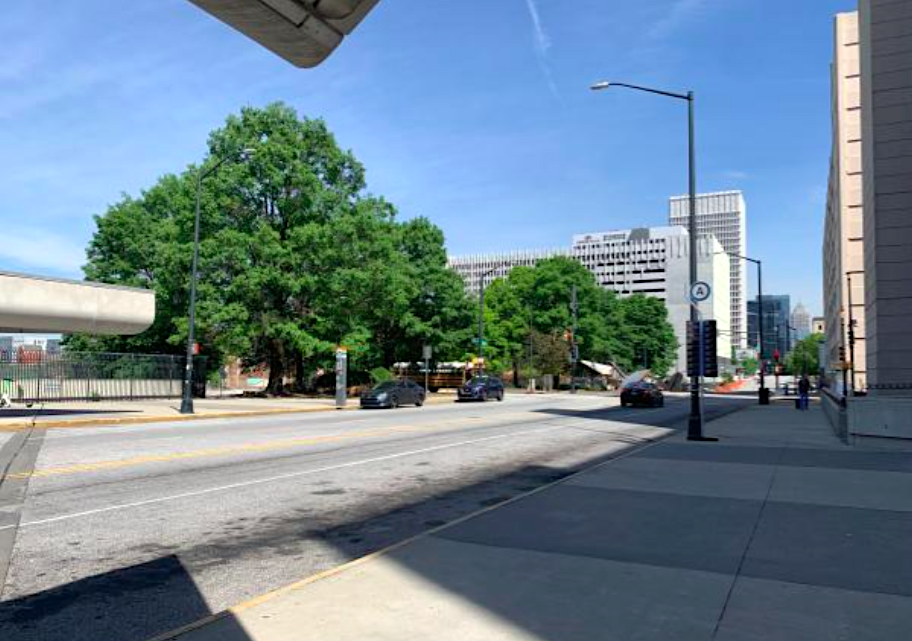
Conditions just north of the MARTA station today. Atlanta Downtown Improvement District/MARTA

What the study identified as Site A between the Connector, MARTA station, and Twelve Centennial Park tower. Atlanta Downtown Improvement District/MARTA

The bus transfer facility's Horseshoe Alternative would be located within Site A. It would include a bus loop with space for roughly five bus bays.Atlanta Downtown Improvement District/MARTA

The larger Overbuild option would extend from Site A across the Connector, providing space for nine bus bays. Atlanta Downtown Improvement District/MARTA

This option would be designed for minimal impacts to Site A, with about four bus bays. The project team is also exploring a fourth alternative that would improve the existing bus transfer facility a block north of the station. Atlanta Downtown Improvement District/MARTA

Subtitle
“Exhaustive analysis” conducted for potential sites within 1/4 mile of MARTA’s Civic Center station
Neighborhood
Background Image
Image
An image showing a large development site next to a MARTA train station and wide highway in Atlanta.
Before/After Images
Sponsored Post
Off
Read the whole story
ARCEvolution
2 days ago
reply
Share this story
Delete

USDOT Issues Grants for Resilient Transportation Infrastructure

1 Share
USDOT Issues Grants for Resilient Transportation Infrastructure Diana Ionescu Mon, 04/15/2024 - 05:00
Primary Image
Aerial view of five-level freeway interchange in Houston, Texas with bridges spanning green bayou.

A new round of grants from the U.S. Department of Transportation (USDOT) targets projects that build resilience and make transportation infrastructure more resistant to the impacts of climate change, reports Susan Carpenter for Spectrum News. “The grants will go to 80 projects in 39 states, the District of Columbia and the Virgin Islands to address geographically specific issues, including $56 million to build a taller bridge in a flood-prone area of Cedar Rapids, Iowa, and $33 million to install a new drainage and sewer system to protect a subway line in New York City that serves one million riders daily.”

This marks the first time the federal government has partnered with local and state governments to specifically address the resilience of transportation infrastructure. According to the article, “The United States received a C- grade overall on the most recent American Society of Civil Engineers Report Card for America’s Infrastructure. While rail received a B, bridges received a C, roads and dams received a D and transit received a D-.”

In announcing the grants, U.S. Transportation Secretary Pete Buttigieg said, “It’s not an exaggeration to say that extreme weather driven by climate change is one of the biggest threats to our infrastructure, to quality of life and safety in our community.”

Geography
Publication
Publication Date
twitterfacebooklinkedinemailemailShare1 minute
Read the whole story
ARCEvolution
4 days ago
reply
Share this story
Delete

Workforce Pipeline Snapshot: Georgia College-Going Rate from 2015-2021

1 Share


We're taking a deeper look at data from our Georgia Workforce Pipeline Snapshot.

While high school graduation classes have gotten bigger, the proportion of graduates going on to post-secondary has declined from 64% to 61% in just 7 years. 

Our Georgia Workforce Pipeline Snapshot includes information on education and the labor market. The graphically engaging tool is a go-to resource for people in industries across the state.

View the entire Snapshot.

View more information on individual data from the Snapshot.

Read the whole story
ARCEvolution
4 days ago
reply
Share this story
Delete
Next Page of Stories